Finally, the last classifier. Will it be the best one at the end? Yes! Previous SVM classification will be replaced by a discriminant analysis model. Discriminant analysis in short: its principle is very similar to the naive Bayes approach – probabilities, statistics and optimization mixed up together.
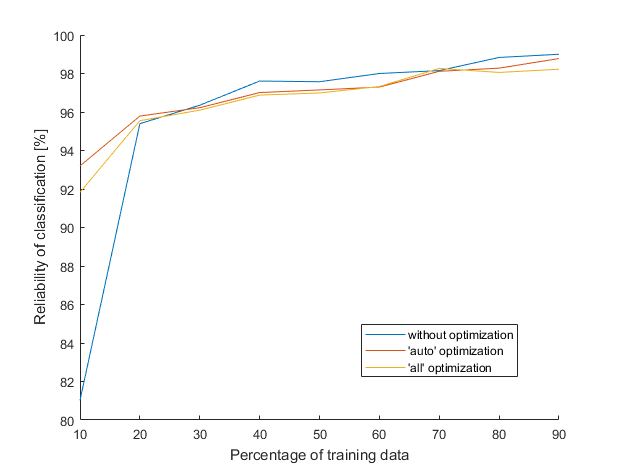
The approach is the same as always: we will create a discriminant analysis model based on training data, then a reliability of the model will be tested on some samples. The graph is also the same as always, just the results differ. The tables compare reliability (when percentage of training data is 70 %) of all five classifiers and the computational times that MATLAB needs to create them. All data except the last results from dicriminat analysis models were mentioned in previous posts.
| Mode | Clasification tree | k-nearest neighbors | Naive Bayes | Multiclass SVM | Discriminant analysis |
| without optimization | 91.2 % | 73.4 % | 96.5 % | 96.6 % | 98.2 % |
| ‘auto’ optimization | 89.2 % | 94.9 % | 96.9 % | 97.4 % | 98.1 % |
| ‘all’ optimization | 90.9 % | 96.3 % | 97.2 % | 97.4 % | 98.3 % |
| Mode | Time per one tree | Time per one k-NN | Time per one NB | Time per one SVM | Time per one DA |
| without optimization | 0.01 s | 0.02 s | 0.03 s | 0.07 s | 0.02 s |
| ‘auto’ optimization | 46.3 s | 58.6 s | 97.2 s | 112.4 s | 50.7 s |
| ‘all’ optimization | 65.5 s | 94.3 s | 108.9 s | 145.6 s | 84.3 s |
Nice, the lines finally approach 100 % reliability. The mean values are around 98 %, but there is a lot of cases where the model returns exactly 100 % reliability. The only imperfection is that I’m not 100 % sure how it works. An unknown sample is somehow assigned to the class based on a probability.
To sum-up everything I would like to compare all five classifiers at once. I chose the mode without optimization of hyperparameters, because in most cases it didn’t improve reliability of models anyhow; it only costs lots of time [1]. Then I could afford to increase the number of created models from 50 to 2500 (for each percentage of training data with step 10 %), and thereby increase accuracy. All data were standardized.
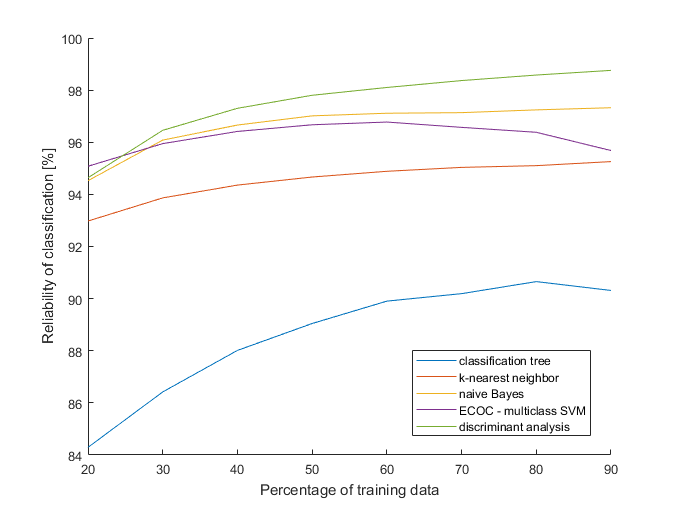
The result speaks for itself. Discriminant analysis is clearly the best, followed by naive Bayes. Poor trees, they have the nicest visualization, but being overcome by each classifier is not very pleasant for them. On the other hand, waiting for the results from optimized multiclass SVM classifiers tested my patience at most (I would like to remind once again, it was more than 32 hours). A final note, the results are valid only for this dataset, thus they can be different for other data. Then, testing classifiers on various datasets could be a next challenge.
1. I’m not saying that a hyperparameter optimization can’t be useful, just that it is not very suitable for the cases where thousands of models are needed ↩